Overview
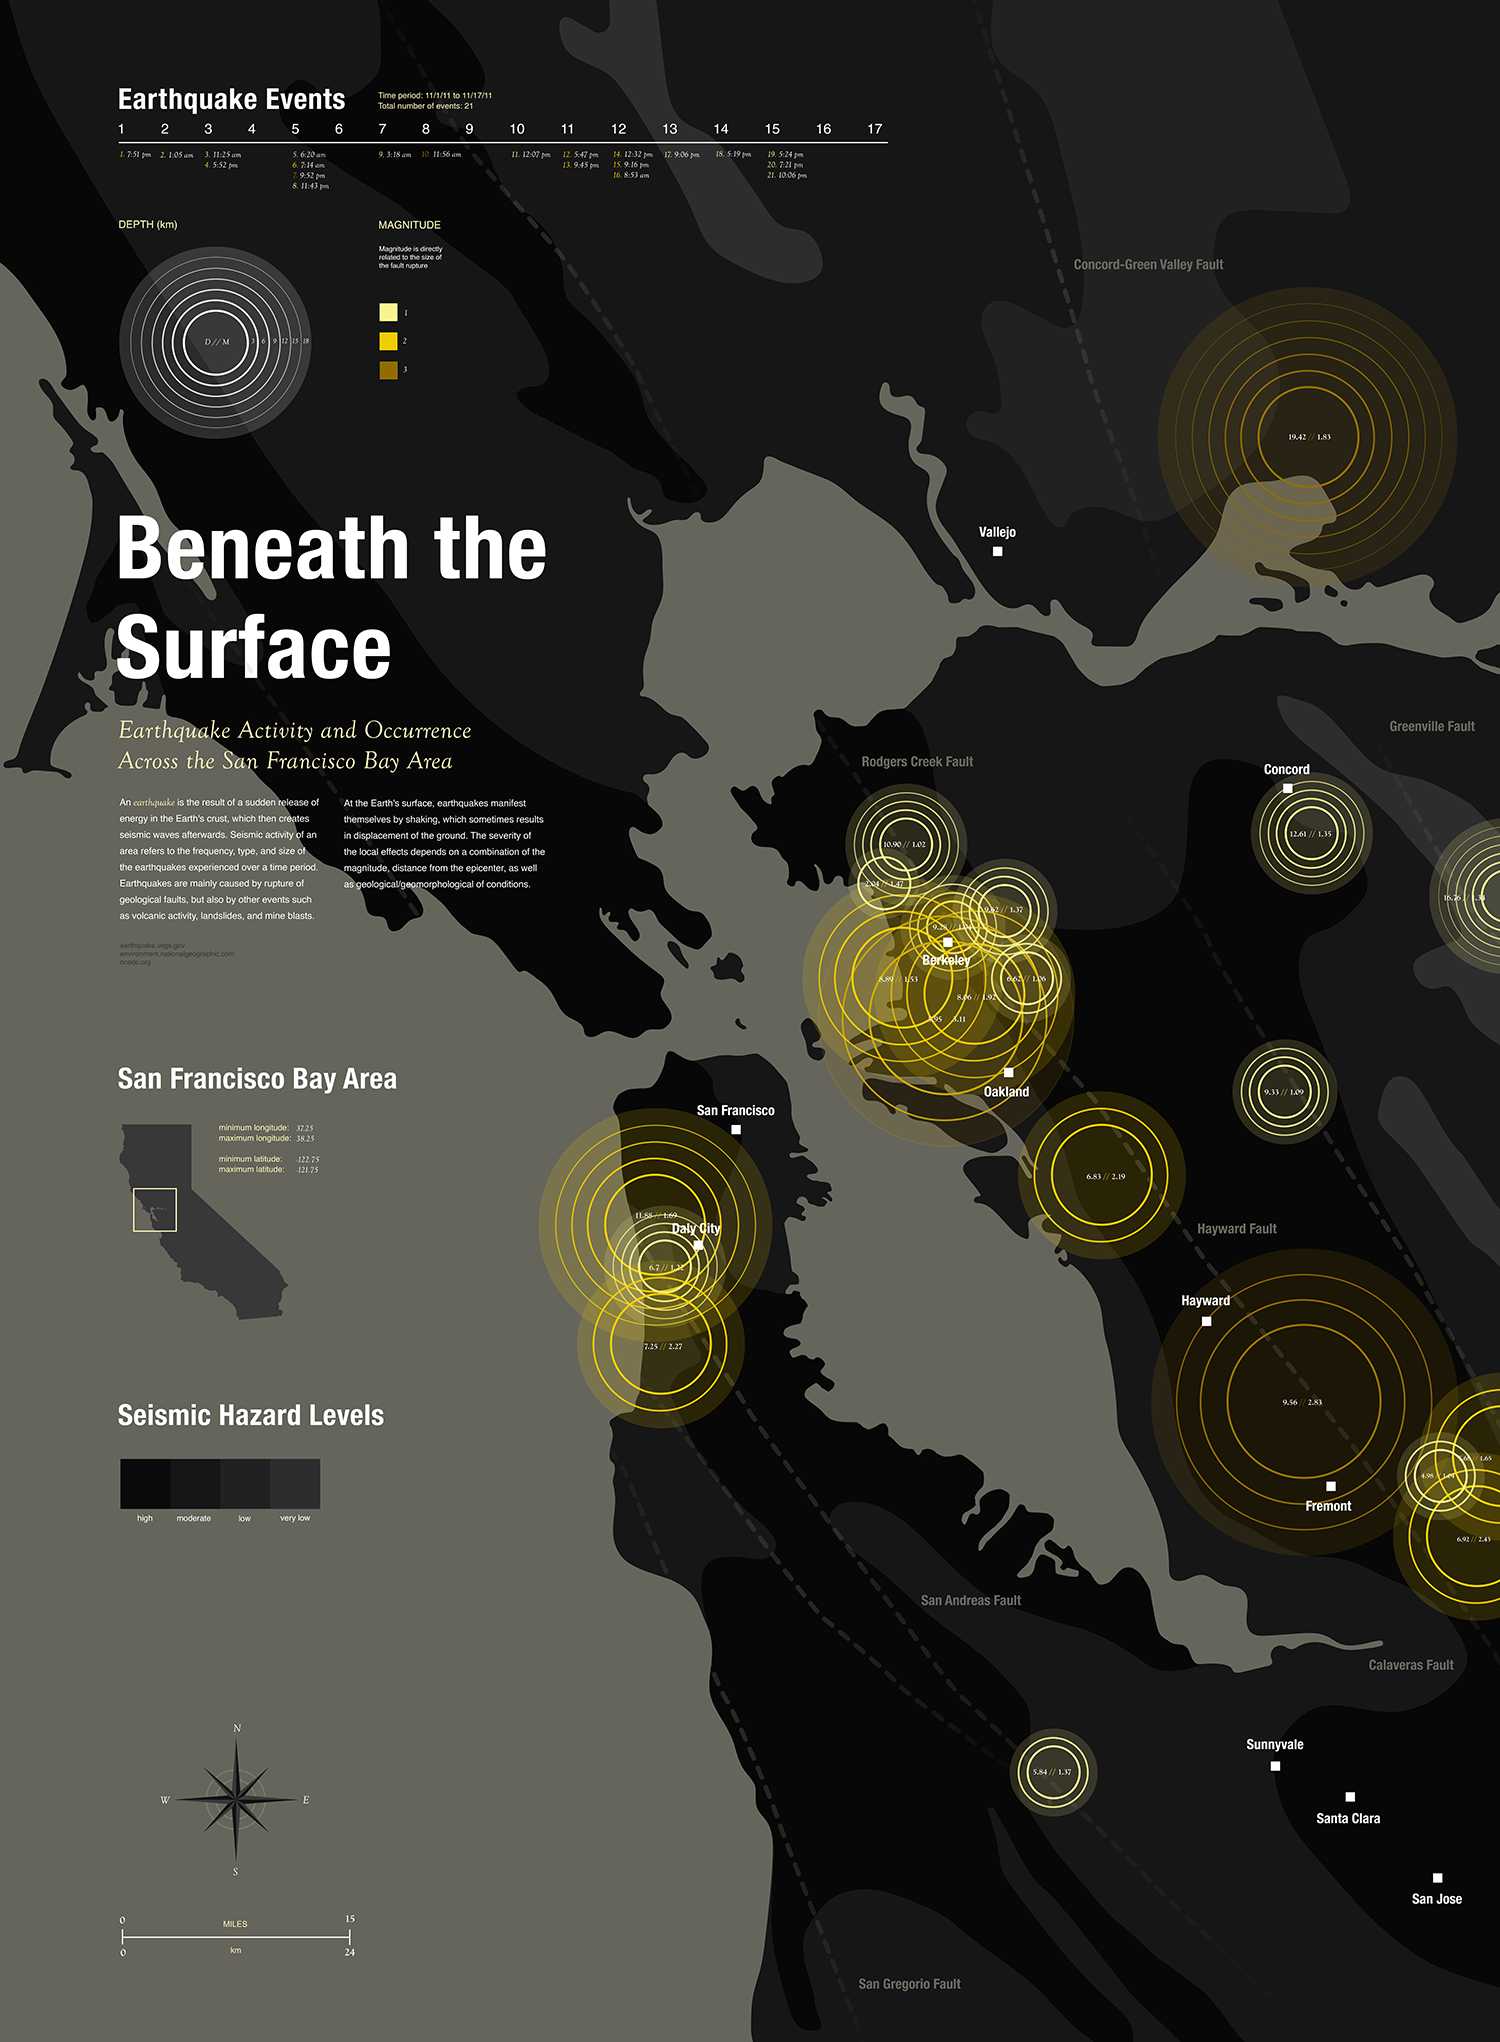
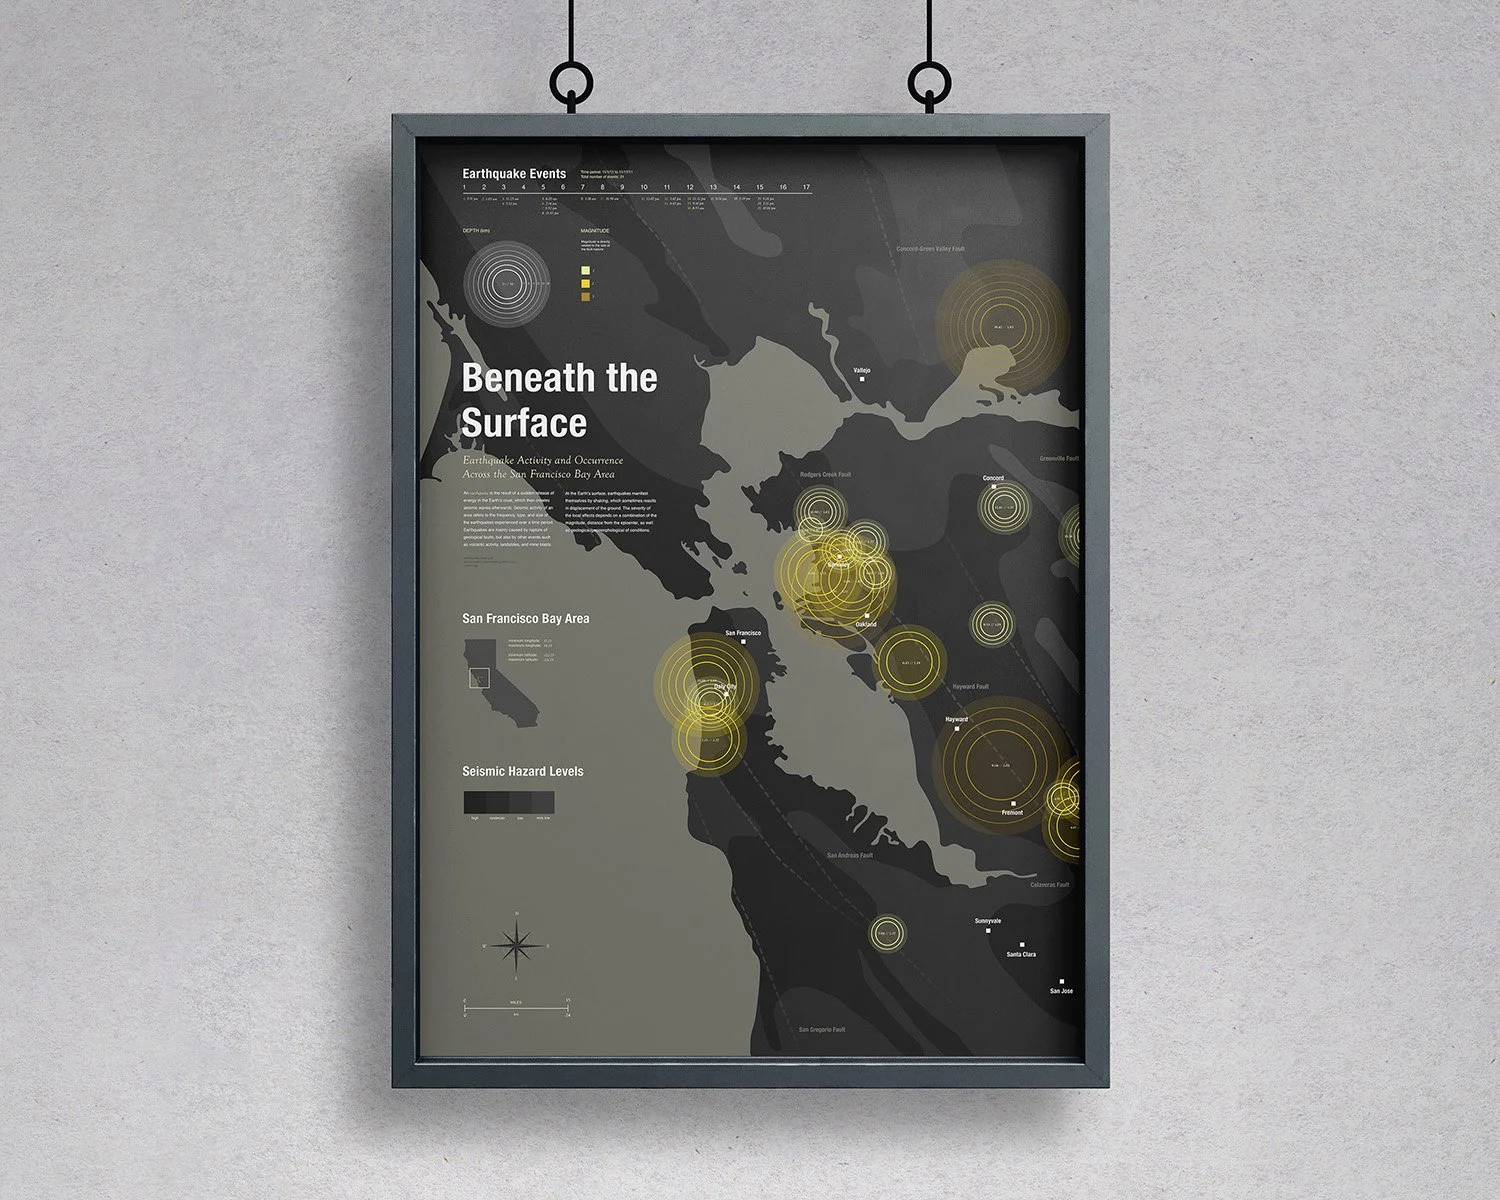
An earthquake infographic charting San Francisco Bay Area seismic events over a one-month period. Displayed information includes the date, location, depth, and magnitude of each earthquake event, along with the seismic hazard levels of the surrounding area.
Design Process
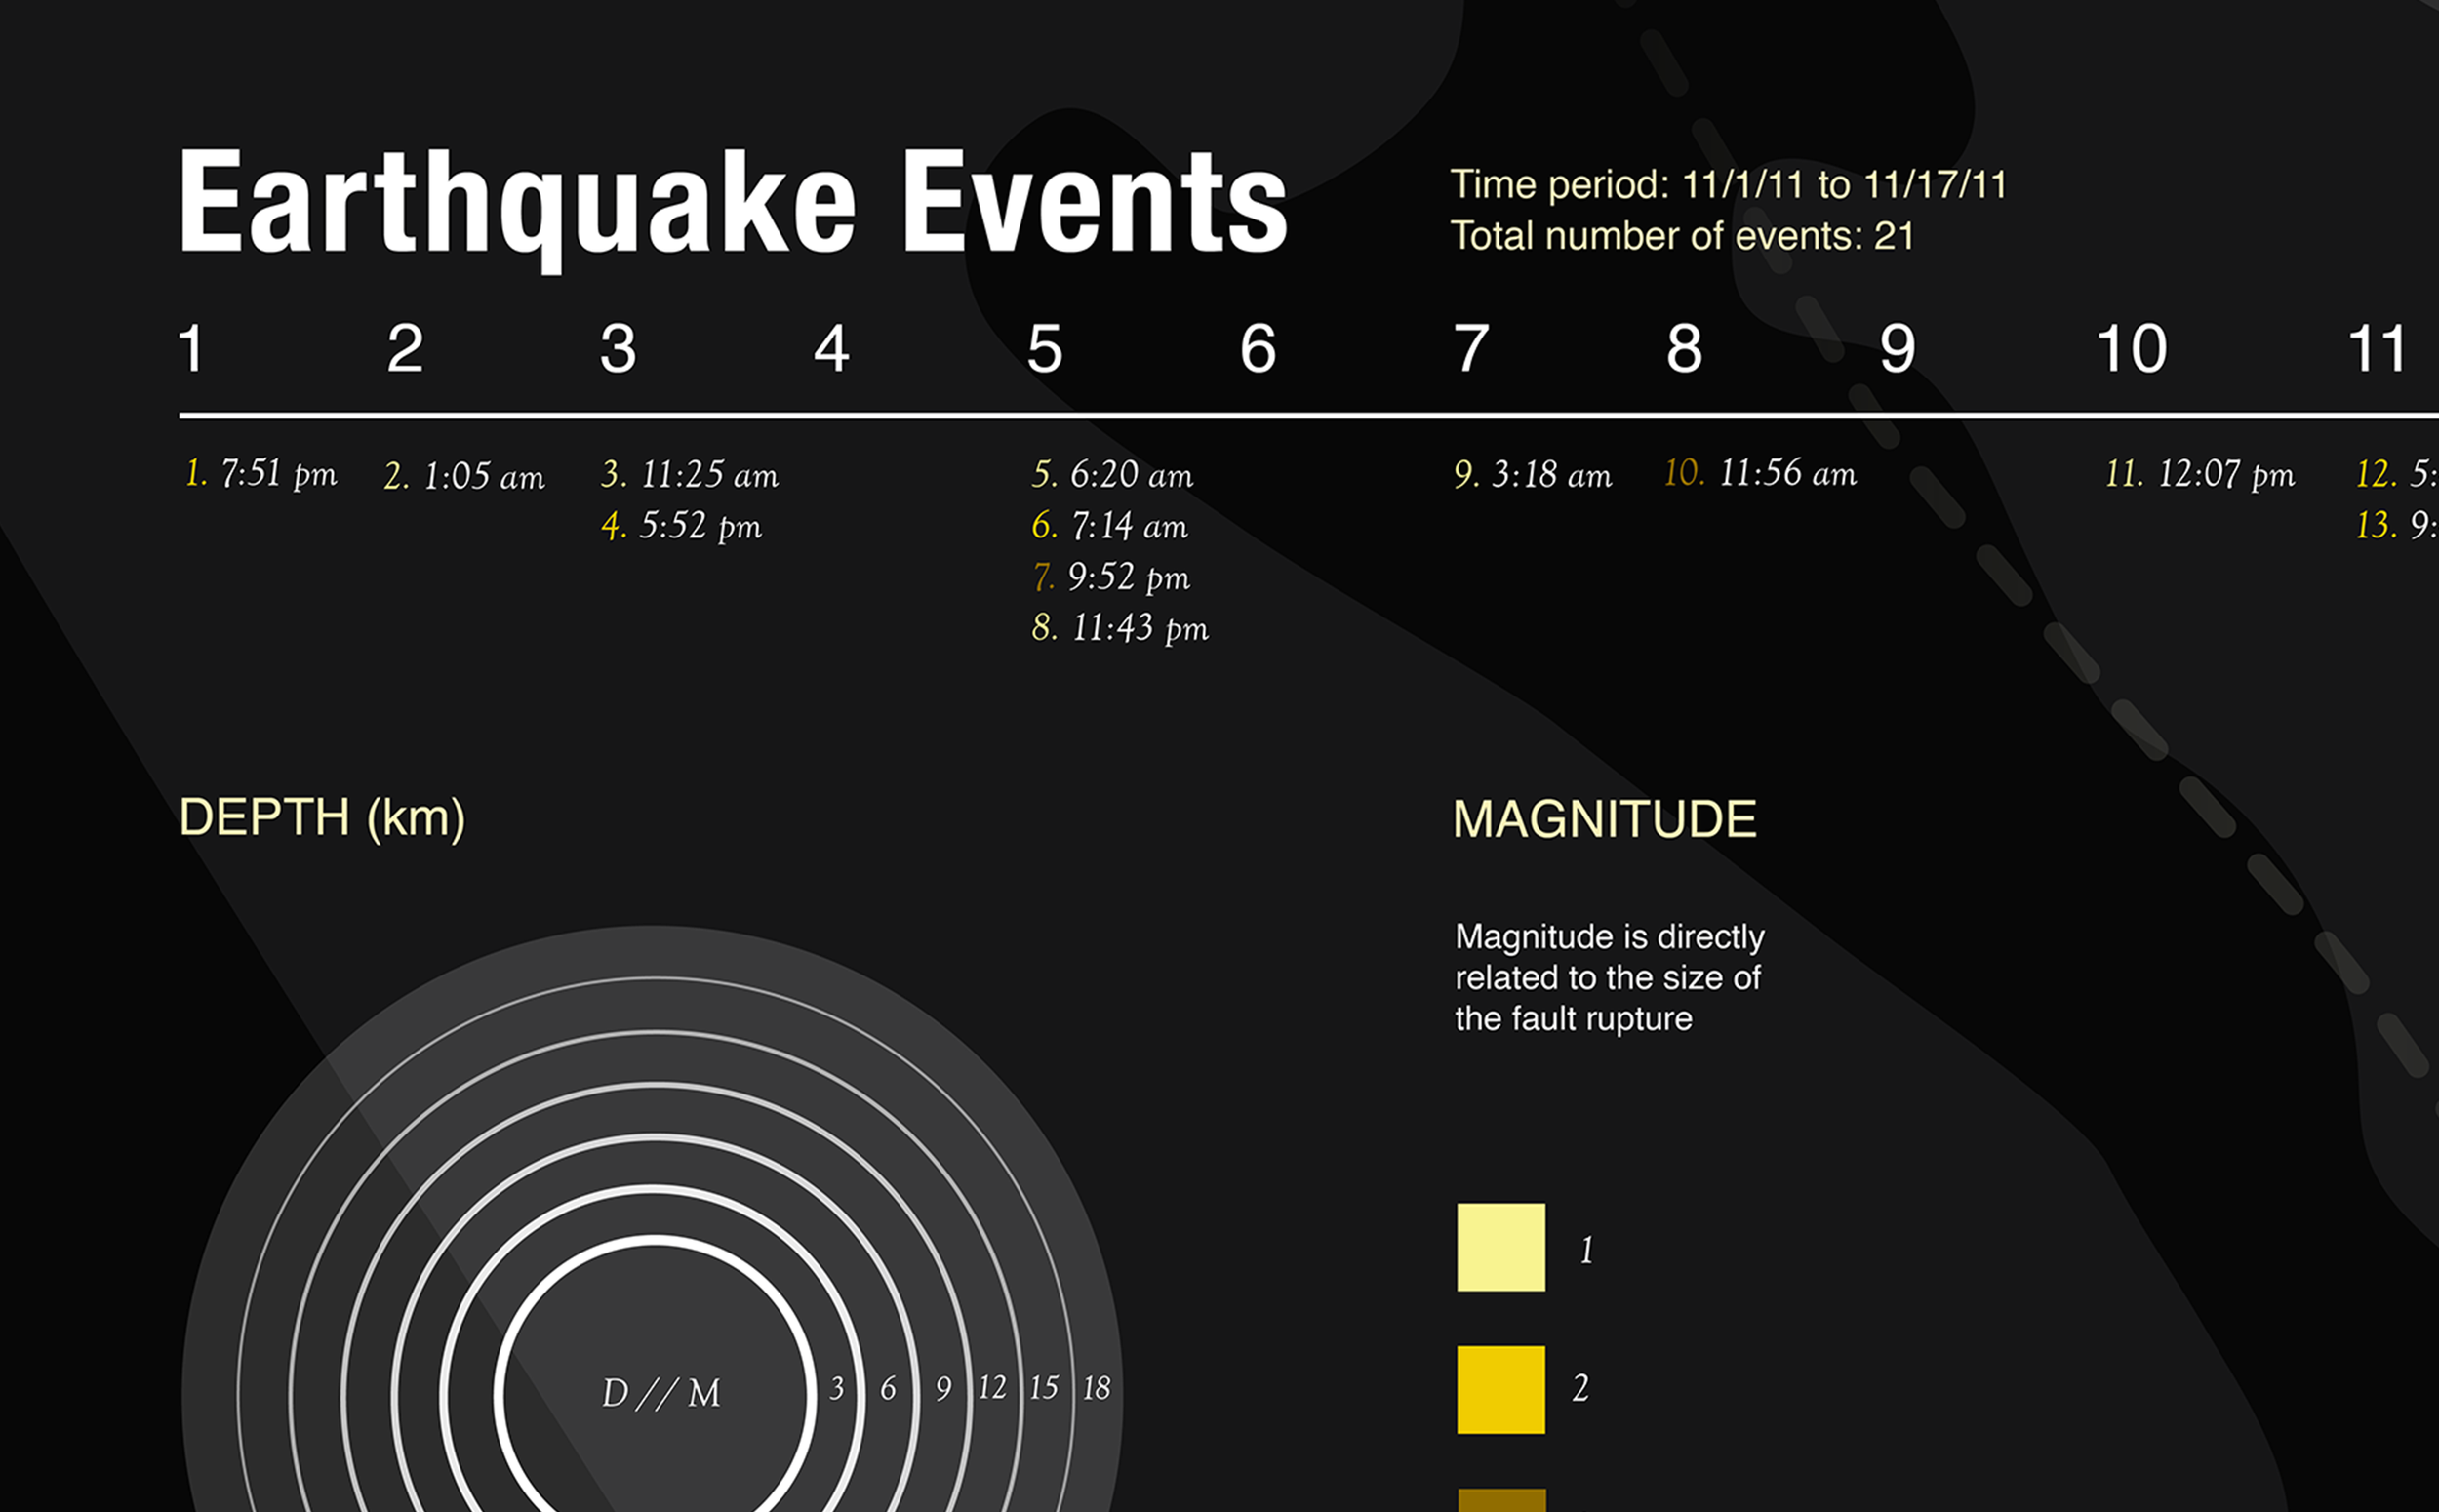
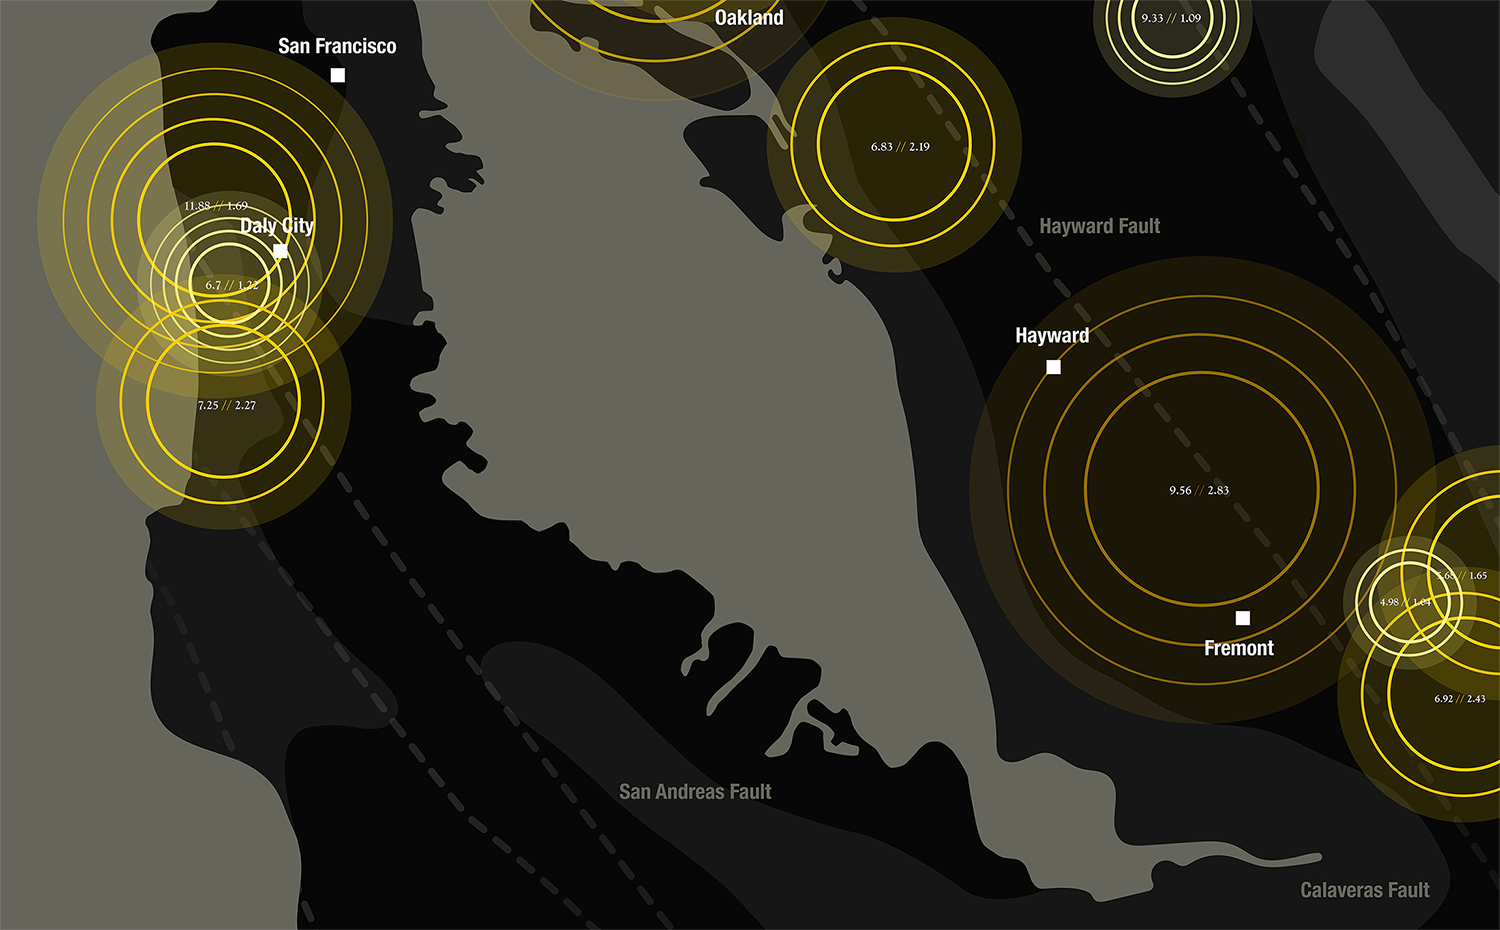
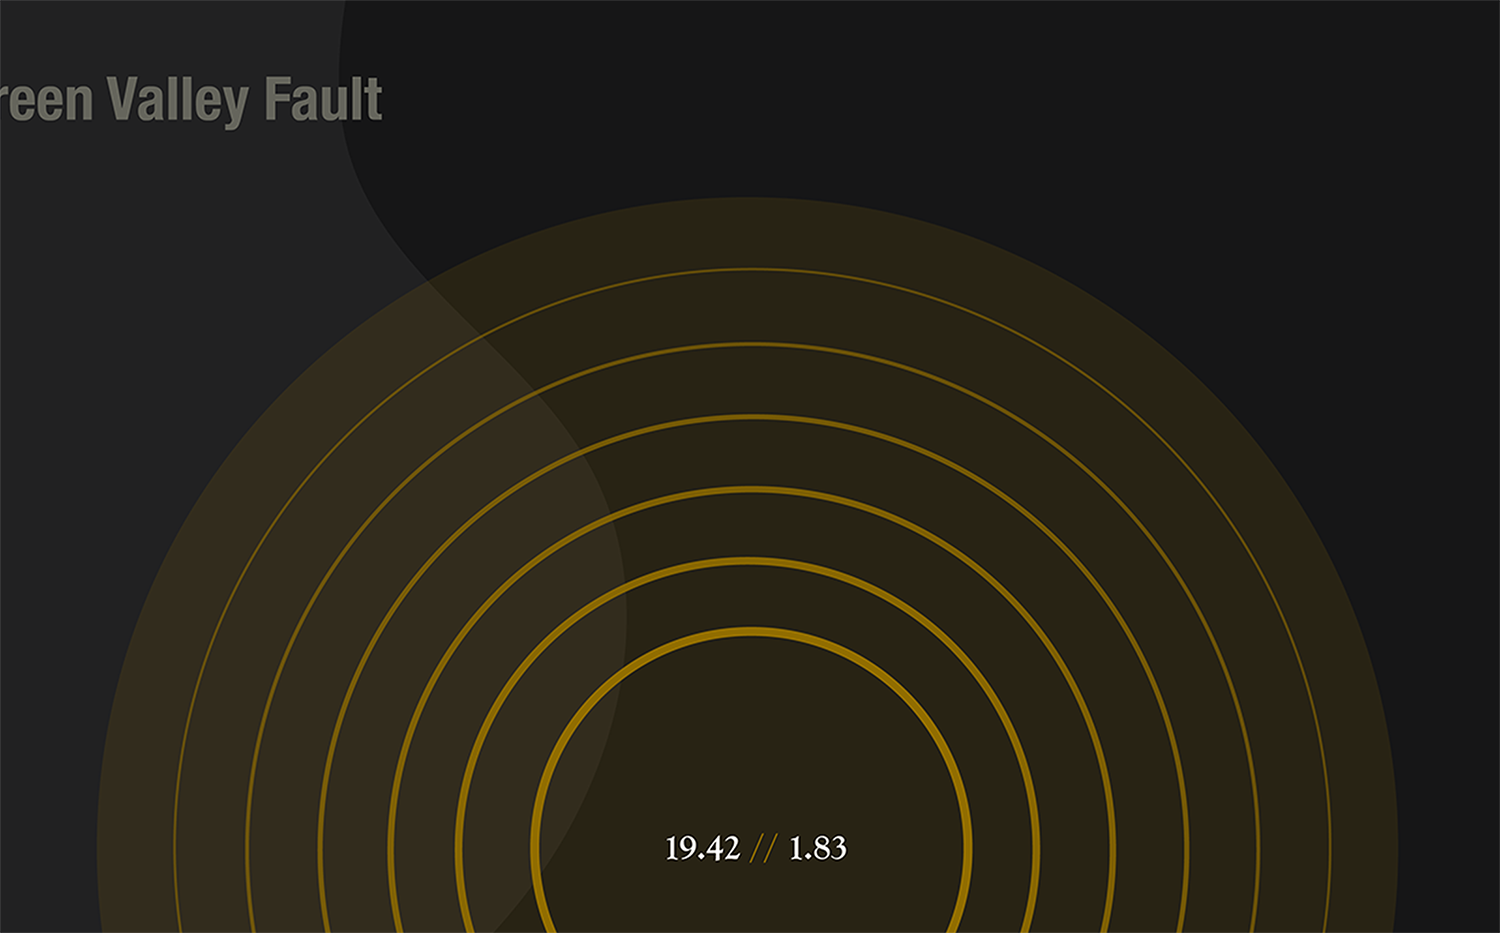
This project visualizes earthquake data with both clarity and visual interest on both a macro and micro level, allowing the content to be easily understood at first glance while providing more nuanced detail and information when viewed up close. Recorded data was visually represented through the use of protruding lines to indicate earthquake depth, line weight to represent the vibrational intensity of each event, and color to represent the magnitude of the fault rupture. Seismic hazard levels of the surrounding area are also shown in tonal grayscale.